6. Using Analytics Dashboards
In analytics terms, a dashboard is a
single-page view that contains your most critical metrics all in one
place. Of course, your most critical metrics are different from those of
the next publisher, because the needs of different sites vary
greatly.
In addition, multiple dashboards may be required in any given
organization. For example, the CEO of a large public company probably
wants to see different data (and a lot less of it) than a senior
business analyst.
Each analytics package provides methods for implementing a custom
dashboard. Figure 6 is an example of one from
Unica’s Affinium NetInsight.
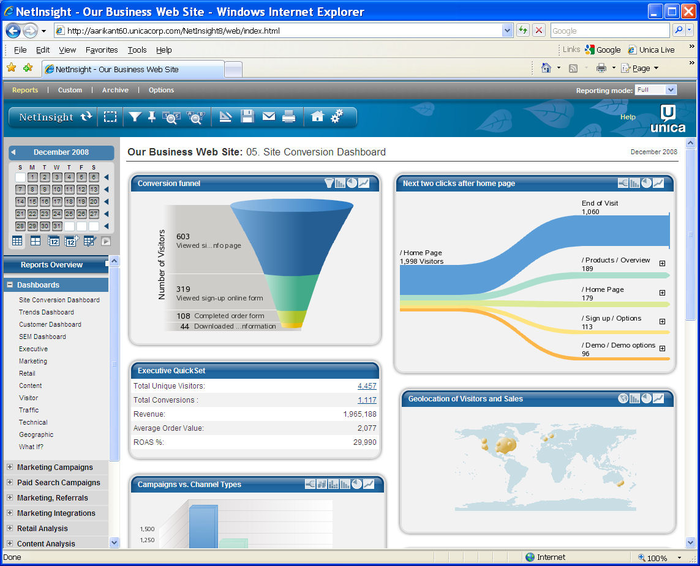
As you can see from Figure 6, a
dashboard can be quite visual. What is most important, though, is that
it provides the data that is most important to the person for whom the
dashboard was designed. As an SEO practitioner, you can implement a
dashboard to show progress against the goals you set for your SEO
campaign.
Providing this type of visibility has two important
benefits:
The person viewing the report will appreciate the fact that
she does not have to work hard to do a quick health check on the
progress of the SEO efforts.
You will know what data your managers are looking at. When
something goes wrong (or right), or when management wants to discuss
some aspect of the business, they will have started from the
dashboard you set up for them.
7. A Deeper Look at Action Tracking
Action tracking is one step deeper than basic analytics. Rather
than simply observing what pages are visited and how many unique
sessions are logged, action tracking allows you to narrow down groups of
visitors based on the actions they take on your site.
In most instances, it requires setting up a code in your analytics
program and attaching that code to a button, page load, image rollover,
or other JavaScript-trackable task (a click or hover). Once you’ve
plugged it into your analytics and the website, you can use the action
to refine data you’re already collecting. Figure 7 provides a look at how this
works.
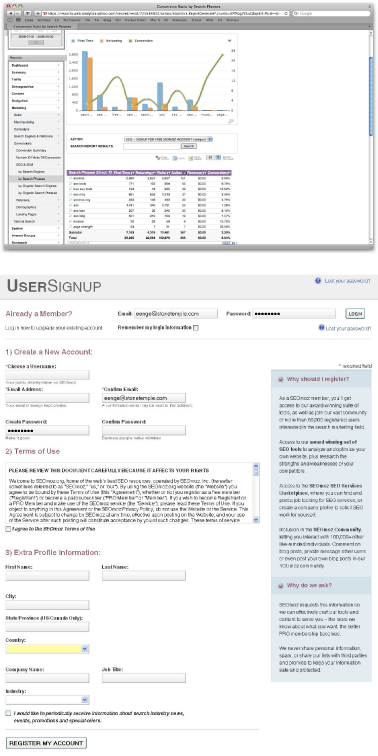
You can see from Figure 9-7
that:
SEOmoz’s sign-up form has action tracking applied to
it.
Based on the people who sign up, you can predict which search
terms will be better at converting visitors into applicants.
The Revenue column is empty, but if you were tracking
e-commerce buyers, you could put their totals into the Revenue
column and track high-volume buyers.
Expanding on this idea, you could also track users by time of
day, the search engine they used, their geographic location, and so
on.
So, what types of actions should you be tracking on your site? The
answer varies depending on your business and site structure. Here are
some suggestions as segmented by site type.
E-commerce site:
Add to Cart button
Studies have shown us that users who “add to cart,” even if
they do not complete the checkout process, are more likely to
return to make a purchase. This is also a good way to calculate
shopping cart abandonment and make changes to refine and improve
the process.
Complete checkout
An obvious one; this action will show you what percentage of
each user group is converting into sales.
Save to wish list
E-commerce sites offering wish lists are still in the
minority, but wish lists are a great way to track interest that
isn’t quite a purchase.
Send this to a friend
Many sites offer a “share this page” function, and it is a
great action to be aware of. If folks are sending out your link,
you know you have a hit.
B2B site:
Subscribe to newsletter
A subscription is a tacit endorsement of your brand and a
desire to stay in contact. It may not be a conversion, but for
B2B, it may be the next best thing.
Contact form submission
A runner-up with subscribing to a newsletter is filling out
the contact form. Though some of these forms will report support
issues, many may contain questions about your products/services
and will indicate a desire to open a sales conversation.
Email link
As with contact forms, direct email links have the
possibility of becoming a sales contact. The best thing you can do
is clearly label sales emails and track them separately from
support or business issues.
Blog:
Subscribe to RSS feed
An RSS feed subscriber is a blog’s equivalent of a
conversion; tracking these is imperative.
Add comment
Anyone who is contributing content to the blog or
participating should be paid attention to (as should those
channels that send you participatory people).
Social bookmark/share
All those folks who are submitting your content to Digg and
Reddit deserve to be recognized (and sought after).
Forum or other site based on user-generated content
(UGC):
Sign up for an account
These users are active contributors; you need to know where
they come from.
Contribute content
When a user publishes, discovering her path is important
(especially if it is not from a bookmark/type-in).
Add comment
As in the preceding list item, comments are a great
predictor of engagement.
Vote/rate
Even low levels of participation, such as a rating or a
vote, are worth tracking when every piece of participation
counts.
You can get very creative with many of these and track all sorts
of actions. If you offer a tool or calculator, track its usage. If you
want to follow who clicks a particular link (rather than just a page),
add an action to it. You can even see which users hover on an
image.
For many marketers, action tracking is the secret sauce. Once you
install and activate this data, it is easy to adjust SEO (or PPC)
marketing efforts on particular terms, phrases, or pages that will make
a huge difference to the campaign’s efficacy.
For SEO professionals, action tracking is a
“cannot-live-without-it” tool. The recommendations made based on this
kind of tracking are backed up by real data. High-volume action-tracking
studies almost always make a huge impact on a site’s bottom
line.
8. Separating the Analytics Wheat from the Chaff
One of the big problems with web analytics is that there is so
much data. There is seemingly an endless supply of the stuff—so much
that you can get lost in the weeds and waste a lot of time. As Yahoo!
Web Analytics’ Dennis Mortensen (http://visualrevenue.com/blog/) likes to say, do not
“report-surf.”
By this he means you shouldn’t get lost in the data, looking at
one interesting fact after another, without understanding what business
objective you are attempting to accomplish. To avoid this trap, you need
to have a plan.
The basis of this plan is the definition of actionable Key
Performance Indicators (KPIs). To summarize this concept very briefly,
do not view a report unless there is a chance that it will provide
enough insight to take action (such as reallocating resources to fix a
problem or pursue a new opportunity you discovered).
8.1. Common analytics mistakes
Because of the complexity of web analytics, there are plenty of
opportunities to make mistakes. Even if you are laser-focused on
actionable KPIs, you can still draw wrong conclusions from the data.
Here are a couple of examples:
Making a decision on too small a sample size
A simplistic example would be if you had a keyword that
brought you two visitors, and both of them bought something.
What does that mean? Your conversion rate will always be 100%?
Of course not.
You need to have a test run for a length of time that is
statistically significant. According to Jonathan
Mendez, long-time evangelist for Offermatica (which is
now part of Omniture’s Test & Target product), the “golden
rule” for test length is 100 conversions per branch (or tested
element). For an A/B test, ideally you would have 200
conversions before you looked at the results. However, if after
50 conversions you have 40 on one branch and 10 on the other,
your test is over. If your variance in results is lower, you
need more data to make sure the data you are seeing is
accurate.
Not recognizing when you have enough data
You can make this mistake in the opposite direction too.
When you have enough data, you need to be willing to act on
it.
Working with biased data
You can easily collect biased data and make the wrong
decision. For example, an e-commerce site basing its SEO plans
on December’s traffic numbers is probably being misled. And
temporal factors aren’t the only cause—visitor locations,
referral sources, and in-house campaigns to existing lists can
all skew information.